
 Master of Public Policy
 Master of Public Affairs
 Master of Development Practice
 Doctoral Program
 Global and Executive Programs
 Undergraduate Programs

 Diversity, Equity, Inclusion
 Student Groups
 Alumni
 Directories

 Faculty
 Publications
 Working Papers
 Centers
 News Center
 Policy Initiatives

 For Students
 For Employers
 Career Events
 Employment Statistics
 Client-based Projects
 About GSPP
 Events
 Make a Gift
 Find a Program
 Find a Faculty Member
 Find a Center
Results & Quality Factors
Summary of the study
We performed a comprehensive, quantitative study of a sample of cookstoves offset projects, examining how the methods they used to estimate their emissions reductions compare with best methods from the academic literature. Our sample included 51 projects from 25 countries, representing 40% of credits from the five methodologies that had generated almost all credits from cookstoves offset projects on the voluntary carbon market.
Quality factors
We performed a detailed review of the literature informing each of the factors used to estimated emissions reductions from efficient cookstoves and filled in some of the gaps with additional analysis. Here we describe our findings on each factor. We then used these findings to re-estimate the emissions benefits from our sample of cookstoves offset projects.
Adoption, usage, stacking, and rebound
“Adoption” : the % of distributed stoves in use
“Usage” : the % of meals cooked using an adopted project stove
“Stacking” : the % of meals cooked using the baseline stove(s) in concert with the project stove
“Rebound” : the increase in cooking performed with the introduction of an efficient stove
These are the definitions that we use in the paper and below. But note that methodologies sometimes define these rates differently; most refer to adoption as “usage,” and some include stacking as a source of leakage (see Table 1).
Methods for monitoring adoption, usage, and stacking fall into three categories:
- Household surveys
- Kitchen performance tests (KPTs)
- Direct monitoring with meters or sales data
AMS-I.E, GS Simplified, and AMS-II.G track them through short surveys on a sample of households. Surveyors go door-to-door to a subset of households to ask a set of questions to achieve specific statistical confidence and precision. GS TPDDTEC requires in-field, multi-day kitchen performance tests (KPTs) for a sample of households. Surveyors will spend a few hours to a few days in a community, going to the household daily to monitor and weigh fuel use, capturing both usage and stacking rates. Results are then applied to the full set of project households, according to adoption surveys on a sample of households. GS Metered uses the most robust approach, directly tracking project stove and fuel use in all participating households through meters attached to the stove and/or by measuring fuel consumption (typically via fuel sales data).
Surveys are popular, but have large limitations.
All default surveys used by the methodologies are infrequent and simplistic. They also are written in ways that have several well-documented biases. They are infrequent and poorly worded, and thus vulnerable to recall bias, when respondents struggle to remember what and how they cooked over a long time period. The surveys are also vulnerable to desirability bias, another well documented form of bias that occurs when respondents provide answers (such as inflated adoption and usage rates) which they believe the surveyors (hired by project developers) want to hear.
AMS-II.G’s default survey provides a good example of how simplicity exacerbates vulnerabilities to desirability bias. The survey simply asks households if they used the improved stove in the last week or month. Developers can then assume this means that households used the stove 100% of the time during the one- to two-year crediting period, with a small discount if they also reported using the baseline stove in the last week or month. Households, wanting to please surveyors by giving the "correct" answer, may alter either their behavior in the period immediately prior to a survey or answer inaccurately, which leads to overcrediting when the survey values are extrapolated to cover the whole crediting period.
Kitchen Performance Tests (KPTs) are better, but still vulnerable to biases.
When done well, KPTs (required by GS TPDDTEC) are better than surveys — but they come with their own weaknesses. As a form of social desirability bias called the Hawthorne effect, households may change their behavior in the presence of project staff who can observe their stove choices while weighing the fuel. Also, due to cost, KPTs are only required every two years on a sample of households; however, stove usage, stacking, and fuel quality and availability can be seasonal and highly variable. Thus, KPTs might not accurately represent stove use across the participant pool over the two-year crediting period. These weaknesses are also true of surveys.
Direct monitoring with meters or sales data is the most reliable method.
The most reliable method is to track adoption and usage continuously through meters attached to the stove and/or by measuring fuel consumption (typically fuel sales data). By measuring households' stove usage throughout the entire crediting period, projects can avoid introducing the biases and uncertainties KPTs and surveys are prone to.
Only GS TPDDTEC accounts for rebound.
When households gain access to an efficient stove, they sometimes increase how much they cook, reducing the carbon emissions saved. This is an effect known as rebound, and it can occur for a variety of reasons. Rebound can happen because the improved stove makes cooking less expensive, and households become less careful about conserving fuel. Rebound can also happen if households could not previously afford the fuel to cook as much as they would like to cook for their families (called "suppressed demand") but now can. There are mixed views on whether rebound due to suppressed demand should be taken into account in carbon benefit calculations. Currently, only projects that conduct KPTs (i.e. GS TPDDTEC) account for rebound.
⇒ See our recommendations for accounting for adoption, usage, stacking, and rebound
Determining total change in fuel consumption
Additional steps are needed to translate monitored adoption, usage, and stacking values into fuel consumption.
Each methodology uses a different approach. For example, GS TPDDTEC uses KPTs which physically weigh all fuel consumption in the project (and thus doesn’t need separate usage and stacking rates). In contrast, GS Metered measures fuel consumption through meters or purchase data and thus doesn’t require separate adoption, usage, or stacking rates, but does need to monitor rebound. It is confusing! We try to outline each methodology’s approach, but refer to Table 1 for full details.
Methodologies use three approaches to estimate the difference between baseline and project fuel consumption.
- AMS-II.G and GS Simplified determine baseline fuel consumption, and then use stove efficiencies to estimate fuel use savings.
- GS TPDDTEC determines baseline and project fuel consumption separately, and calculates emissions reductions as the difference between the two.
- GS Metered and AMS-I.E back calculate baseline fuel consumption from the measured/surveyed project fuel use assuming the equivalent energy would have been used in the baseline by the less efficient baseline stove.
AMS-II.G, GS Simplified, and GS TPDDTEC allow projects to determine total baseline fuel use using
- a default value (0.4-0.5 tons of firewood/capita/year)
- literature or national survey data
- their own survey
- or a KPT (rarely chosen)
To determine stove efficiencies, AMS-II.G and GS Simplified use default values for the baseline stove and a laboratory test for the project stove.
GS Metered and AMS-I.E convert project fuel emissions into emissions savings using an emission conversion factor. That factor is based on estimates of baseline fuel consumption using default values, literature, or surveys.
Limitations of these options to estimate fuel consumption
Unfortunately, the CDM’s default values for baseline stove efficiencies are lower than those found in the literature, project stove efficiencies are rarely as high as found in a laboratory, and KPTs are highly variable due to specific field conditions. Additionally, households answering project-led fuel consumption surveys and national surveys can struggle to estimate the amount of fuel used, especially as use is seasonal (recall bias), inflate their use of an efficient stove to seem more affluent, or exaggerate their baseline stove use in the hope that they will be selected for an improved stove program (social desirability bias). These biases can result in abnormally high baseline and/or low project values, especially when used together.
⇒ See our recommendations for fuel consumption
Fraction of non-renewable biomass (fNRB)
“fNRB” : the proportion of biomass from non-renewable sources
Projects that reduce biomass use should only be credited for the proportion of CO2 emissions reduced from non-renewable sources (fNRB). CO2 from biomass that would have decomposed and entered the atmosphere even if it had not been used in a stove, such as twigs on the ground, should not be credited. Projects should only be credited for CO2 emissions reductions from biomass use associated with the loss of carbon storage in natural systems.
Previously, all methodologies relied on inaccurate CDM fNRB default values. These defaults are now expired, and projects may calculate their own fNRB values from a CDM tool or assume a conservative 30% default (rarely chosen). CDM's tool overstates forest degradation, resulting in much higher fNRB values compared to published literature. VMR0006 v1.2 has recently announced (as of July 2023) that moving forward if projects do not choose the 30% global default they must discount their emissions by 26%. Published literature (Bailis et al. (2015)’s WISDOM model) provides a more thorough approach as their model, unlike the defaults or the tool, accounts for biomass regrowth, and geographical, ecological, and land use heterogeneity at the subnational level. Building off of the WISDOM model, the most robust fNRB approach to date is a dynamic landscape model called MoFuSS (Modeling Fuelwood Sustainability Scenarios).
On October 13th, 2023, the same team of researchers, funded by the UNFCCC, released new MoFuSS values for most countries in Sub-Saharan Africa and regional values for Central America, South Asia, and South East Asia. They are as low or even lower than the Bailis et al. 2015 values. If the new MoFuSS value is available, we recommend using it, and if not, we recommend using the Bailis et al. 2015 WISDOM values until it is released.
We do note that a shortcoming of the 2015 WISDOM values is that they do not distinguish between replacing firewood and replacing charcoal. While firewood used in rural areas may have a low fNRB as firewood comes largely from biomass collected from the ground (e.g., dead branches), this may not be true for charcoal. Ideally, there should be different fNRB values for replacing firewood and for replacing charcoal. However, this research represents the best available data on fNRB.
Emission factors (EFs)
“Emission factors” : the amount of carbon dioxide equivalent released per unit of cooking fuel from the production, transport, etc. up through the actual use/combustion of the cooking fuel
All cooking fuels have CO2 and non-CO2 emissions at the point of use, and all except for collected firewood have upstream emissions. Calculating the offsets associated with more efficient cookstoves requires translating baseline and project fuel usage into GHG emissions.
Emission factors are critical parameters for these calculations, so how methodologies choose to approach them has a big impact on the credits a project generates.
Currently, GS and CDM methodologies take very different approaches. GS uses outdated IPCC default emission factors (EFs) from 2006 for both CO2 and non-CO2 gasses. GS methodologies make lifecycle emissions accounting (i.e., includes upstream emissions) optional, a source of under-crediting when excluded.
Instead of using values for each fuel as Gold Standard does, the CDM uses an alternative emission factor of a hypothetical fossil fuel that would replace the biomass use. This is to avoid crediting reductions from deforestation, which the CDM does not allow. In other words, the CDM pretends that the baseline emissions are from fossil fuels, not biomass. The baseline emission factor is called an emission factor from a "projected fossil fuel" since households could adopt fossil fuels in the future. Since the emission factor of fossil fuels (a regional, weighted average of kerosene, LPG, and coal) is lower than that of non-renewable biomass, this choice is actually conservative, because using it reduces the maximum number of credits a project can be issued.
Emission profiles (point of use and upstream) of various cooking fuels vary widely in the field, depending on characteristics like moisture content, wood type, sourcing of feedstock, characteristics of production, and distribution. Since the IPCC values were established, there have been a considerable number of studies specifically looking at the lifecycle emissions of cooking fuels. Recently, Floess et al. compiled a database of lifecycle emission factors for cooking fuels, drawing from peer-review literature, the EPA/CCA’s analysis, and the Greenhouse Gases, Regulated Emissions, and Energy Use in Technologies Model (GREET) model. We suggest projects use these values since they are the most recent and robust values and also are cooking fuel specific.
Study Results
We found that our project sample had generated 9.2 times more credits than our independent analysis. Extrapolating to the full set of cookstoves offsets using those five methodologies, we found over-crediting of more than 10 times across the full set of projects in total.
Results by methodology
Although all methodologies take the general approach outlined in How the Methodologies Work, each targets different types of projects and monitors and estimates emissions benefits differently. Table 1 of our article lays out the major differences. These differences, combined with features of the specific projects that choose to use them, result in different levels of over-creditig.
CDM’s AMS-II.G credits projects that replace traditional cookstoves with improved biomass (wood, charcoal, pellet, etc.) cookstoves, ovens, or dryers and was designed for smaller projects, capped at 60 GWhs per year.
GS Simplified is GS’s version of AMS II.G, which replaces traditional cookstoves with improved wood or charcoal stoves, and was designed for smaller projects, capped at 10,000 CO2e/ year.
GS TPDDTEC broadly credits less greenhouse gas intensive stoves (e.g., improved biomass, heat retention, solar, LPG, electric). This is the most versatile methodology of the five.
GS Metered was designed for cookstoves with metered or other direct fuel monitoring (e.g., purchase records) such as electric, LPG, biogas, bioethanol, or biomass pellet. As of 2020, GS requires all stoves that involve fuel switching to use GS Metered.
Finally, CDM’s AM-I.E replaces non-renewable biomass with renewable energy (e.g., renewable biomass, biogas, bioethanol, electric stoves).
All methodologies take similar approaches to fNRB, allowing projects to use a CDM Tool to derive their own estimate, or assume a global average of 30% (rarely chosen).
Methodologies take very different approaches to establish adoption, usage, and stacking rates. AMS-I.G allows projects to use surveys to establish adoption, usage, and stacking rates, use a laboratory-derived stove efficiency to estimate fuel consumption in the project scenario, and use the odd EF of a fossil fuel instead of the EF of the actual baseline fuel. The laboaratory-derived approach to monitoring the project scenario leaves these projects vulnerable to rebound.
GS Simplified implements a very similar approach except for the EFs as they use the IPCC value for the baseline fuel (typically firewood).
GS TPDDTEC allows projects to use surveys to establish adoption rates, use in-field testing to establish usage and stacking rates, and use the IPCC EFs, even allowing projects to include upstream emissions. In-field tests cover any rebound.
GS Metered only credits projects based on the energy consumed with the project stove, which they monitor through meters or fuel sales data. This approach covers the project’s adoption and usage rates, and removes the need to track stacking. However, these projects are still vulnerable to rebound. GS Metered uses IPCC EFs.
Finally, AMS-I.E allows projects to use surveys to establish adoption, usage, and stacking rates and even project fuel consumption, but does implement the odd EF of a fossil fuel instead of the EF of the actual baseline fuel.
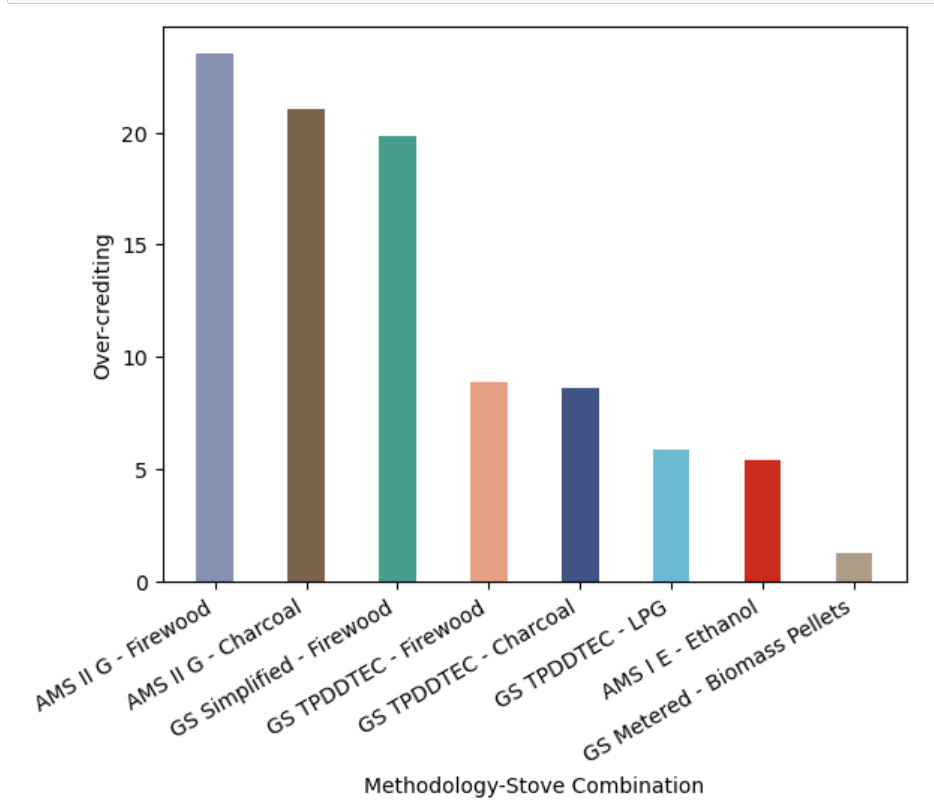
Results by methodology-stove combination
We analyzed projects across eight methodology-stove combinations:
(1) CDM AMS-II.G and Improved Firewood
(2) CDM AMS-II.G and Improved Charcoal
(3) GS-Simplified and Improved Firewood
(4) GS-TPDDTEC and Improved Firewood
(5) GS-TPDDTEC and Improved Charcoal
(6) GS-TPDDTEC and LPG
(7) CDM AMS-II.E and Ethanol
(8) GS-Metered and Biomass Pellet (specific ones that meet the WHO standards)
We found over-crediting across every combination, but GS Metered projects using biomass pellet stoves that meet the WHO’s health standards were most aligned with our analysis.
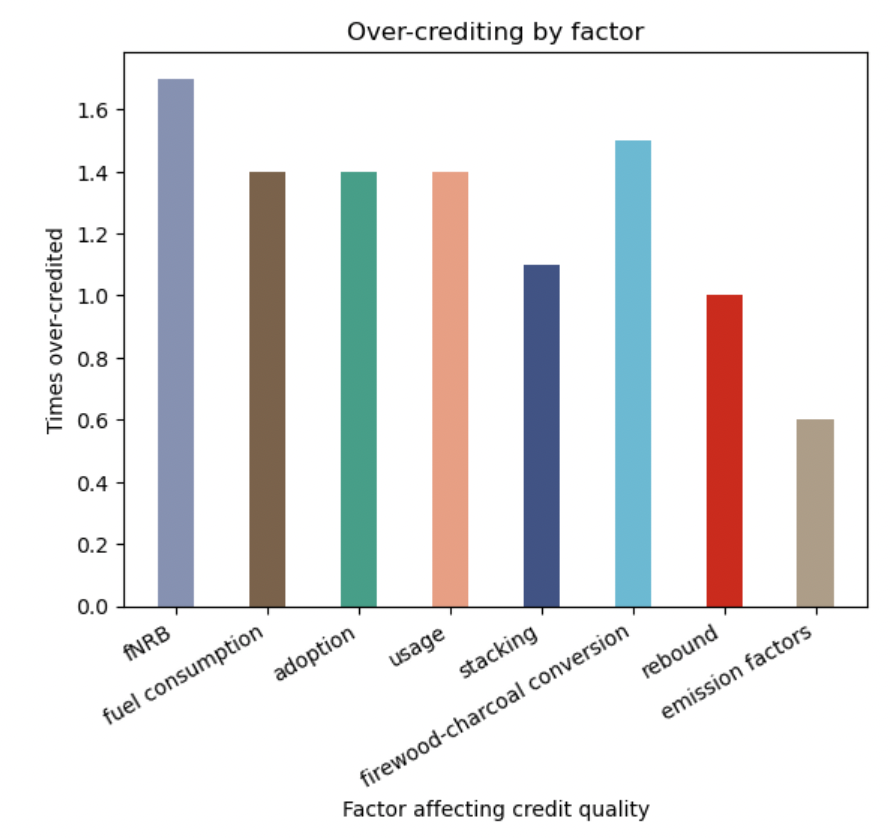
Results by factor
Across the methodologies, methods used for most factors resulted in over-crediting when considered in isolation; only EFs resulted in under-crediting.
The high levels of over-crediting we see with most methodologies results from how over-crediting compounds when multiple over-credited factors are multiplied together to derive total emissions reductions achieved.